Next: Close packing limit Up: The rotator phase Previous: The rotator phase
Next: Close packing limit
Up: The rotator phase
Previous: The rotator phase
A hexagonal crystal consisting of long rods will have a high orientational
correlation as all rods are, on average, aligned. On the other hand,
a solid of short spherocylinders
will behave almost like a hard-sphere solid. In particular, the
orientational
distribution function will have cubic symmetry, approaching an
isotropic distribution in the limit  .
The orientationally ordered solid should (according to Landau theory [109]) be
separated from the plastic solid by
a first-order phase transition.
.
The orientationally ordered solid should (according to Landau theory [109]) be
separated from the plastic solid by
a first-order phase transition.
Usually, it is assumed that hard spheres form an fcc crystal structure.
Near melting, it is known that the difference in stability of the fcc
and hcp structures is very small [39].
In our simulations in the close packed limit (see next section) we
found that the free energy difference between both crystal structures
at close packing is less than  kT .
In what follows, we will assume for the sake of convenience, that the
stable solid structure is fcc, for hard spheres as well as spherocylinder systems.
kT .
In what follows, we will assume for the sake of convenience, that the
stable solid structure is fcc, for hard spheres as well as spherocylinder systems.
We estimated the coexistence region between the aligned and rotator solids
by measuring the equation of state for lengths  = 0.01, 0.1, 0.2 and 0.3 at high densities
combined with free-energy calculations at these lengths. The equations
of state were measured in MD simulations, as described in
section 5.3.1
and are shown in figure 5.6.
The free-energy of the aligned solid was calculated using thermodynamic
integration as described in section 5.3.2.2.
For the rotator phase, we found it more convenient to relate the free
energy to that of a hard-sphere reference system. At a given density
= 0.01, 0.1, 0.2 and 0.3 at high densities
combined with free-energy calculations at these lengths. The equations
of state were measured in MD simulations, as described in
section 5.3.1
and are shown in figure 5.6.
The free-energy of the aligned solid was calculated using thermodynamic
integration as described in section 5.3.2.2.
For the rotator phase, we found it more convenient to relate the free
energy to that of a hard-sphere reference system. At a given density
 , the free energy for a plastic crystal of rods with length L
is given by eqn.
5.22
, the free energy for a plastic crystal of rods with length L
is given by eqn.
5.22
If we keep the reduced density constant, this changes into
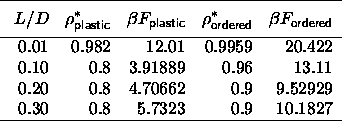
| Table: | Helmholtz free energy per particle
for plastic and orientationally ordered phases with  between 0.01
and 0.3. The free energies are expressed in units of kT. between 0.01
and 0.3. The free energies are expressed in units of kT. |
| Table: |
Pressure and reduced densities of coexisting plastic and orientationally
ordered solid phases for hard spherocylinders with aspect ratios
 between 0 and 0.3. Units as in table 5.3. between 0 and 0.3. Units as in table 5.3. |
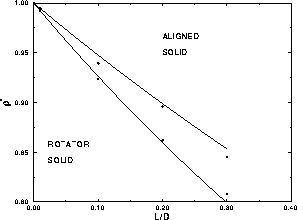
| Figure: | Coexistence curves for the plastic solid -- orientationally ordered solid transition. The filled circles indicate the coexistence densities obtained by off-lattice simulations. The solid lines are the close-packing limit results discussed in section 5.5.2 |
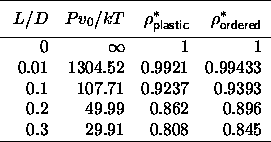
The free energy of the three dimensional hard-sphere solid  is
well known and can be accurately represented using the analytical
form for the equation of state
proposed by Hall [54] in combination with a reference free
energy of a fcc crystal obtained by Frenkel and Ladd [39].
The equations of state are displayed in figure 5.6 and the
results of the free energy calculation are given in table
5.8. Applying the double tangent construction results in table
5.9. It is clear that in the limit
is
well known and can be accurately represented using the analytical
form for the equation of state
proposed by Hall [54] in combination with a reference free
energy of a fcc crystal obtained by Frenkel and Ladd [39].
The equations of state are displayed in figure 5.6 and the
results of the free energy calculation are given in table
5.8. Applying the double tangent construction results in table
5.9. It is clear that in the limit  the plastic-ordered coexistence curve terminates at the density of
regular close packing.
As can be seen from figure 5.7, the densities of the
coexisting solid
phases appear to depend almost linearly on
the plastic-ordered coexistence curve terminates at the density of
regular close packing.
As can be seen from figure 5.7, the densities of the
coexisting solid
phases appear to depend almost linearly on  .
The solid curve in figure 5.7 is an estimate for the
solid-solid coexistence curve obtained by extrapolation of the
simulation data at close packing. The simulation technique used
to study this limit will be discussed below.
.
The solid curve in figure 5.7 is an estimate for the
solid-solid coexistence curve obtained by extrapolation of the
simulation data at close packing. The simulation technique used
to study this limit will be discussed below.