Next: Conclusion Up: What is the Previous: Normal periodic boundaries
Next: Conclusion
Up: What is the
Previous: Normal periodic boundaries
The transition could be second order and the hysteresis might be due
to a slow relaxation to the equilibrium state.
The rate of relaxation is determined by the exchange of molecules
between the smectic layers during compression from the nematic
phase . This diffusion becomes inefficient at higher pressure.
To circumvent this problem we have applied the
shifted periodic boundary conditions to the Onsager system (see
section 5.3.2.3) and
determined the compression and expansion curves again. The results are
plotted in figure 5.17. These equations of state
seem to indicate that the nematic smectic transition is continuous in the
Onsager limit. The continuity also follows from figure
5.18 where  , our measure
for nematic order, is plotted against the reduced density.
, our measure
for nematic order, is plotted against the reduced density.
However, the shifted periodic boundaries suppress the
the herringbone structured smectic fluctuations
phase and inclusion of these fluctuations could make the
transition (weakly) first order again.
In short, we cannot establish with certainty the order of the
N-S transition in the limit  .
To establish the nature of the transition, a full finite size
scaling analysis is required.
As the shifted periodic boundary conditions simulation offer better
statistics, we tend to believe that the N-S transition is continuous.
Since the transition is clearly first order for
.
To establish the nature of the transition, a full finite size
scaling analysis is required.
As the shifted periodic boundary conditions simulation offer better
statistics, we tend to believe that the N-S transition is continuous.
Since the transition is clearly first order for  =5 there should
be a tricritical point at intermediate
=5 there should
be a tricritical point at intermediate  .
This tricritical point has been the subject of theoretical studies.
In refs. [102,103] is estimated that the tricritical point
corresponds to
.
This tricritical point has been the subject of theoretical studies.
In refs. [102,103] is estimated that the tricritical point
corresponds to  5 while the theoretical analysis in
ref [104] suggest that it should occur at
5 while the theoretical analysis in
ref [104] suggest that it should occur at  =50.
The first prediction is clearly incompatible with our simulation
results and those of ref [27]
=50.
The first prediction is clearly incompatible with our simulation
results and those of ref [27]
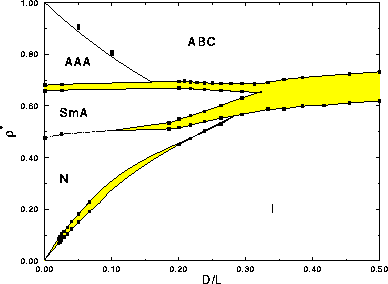
| Figure: |
The phase diagram of hard spherocylinders plotted as a function of
 . In this way we can establish the link between the finite length
region and the Onsager limit at . In this way we can establish the link between the finite length
region and the Onsager limit at  . . |
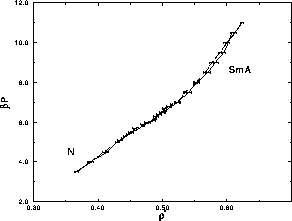
 . The solid line is the equation-of-state for the expansion from a
smectic, the
dotted line is the compression curve started from the nematic. The hysteresis has disappeared due to the use of
shifted periodic boundaries.
. The solid line is the equation-of-state for the expansion from a
smectic, the
dotted line is the compression curve started from the nematic. The hysteresis has disappeared due to the use of
shifted periodic boundaries. 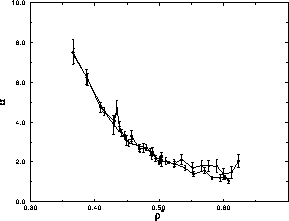
 in an onsager spherocylinder system as a function of reduced
denstity
in an onsager spherocylinder system as a function of reduced
denstity  for a compression from the nematic (filled circles)
and a expansion from the smectic phase (open circles). The hysteresis has disappeared due to the use of
shifted periodic boundaries.
for a compression from the nematic (filled circles)
and a expansion from the smectic phase (open circles). The hysteresis has disappeared due to the use of
shifted periodic boundaries.