The existence of the terminal polydispersity suggests the possibility
of constructing a continuous path from the solid to fluid without
going through a first order phase transition. We do not expect such a
process to be realizable in general, and in this section we show that
it is indeed not possible in the context of our system. The
explanation lies in the infinite pressure limiting behavior of the
model in the isobaric semigrand ensemble.
Consider the partition function of eqn.
4.21
In the limit of  the volume and hence the length
L will go to zero. The quadratic term in L in the exponent
vanishes in this limit, whereas the
the volume and hence the length
L will go to zero. The quadratic term in L in the exponent
vanishes in this limit, whereas the  and the
  terms
remain finite. This is equivalent to the observation that the chemical
potential difference function is becoming a straight line. If we
define a new, always finite, parameter
terms
remain finite. This is equivalent to the observation that the chemical
potential difference function is becoming a straight line. If we
define a new, always finite, parameter  and introduce
 defined above, the limiting
partition function can be written as
defined above, the limiting
partition function can be written as

We can conduct simulations in the infinite pressure limit by using the
integral over x as the 'weighting function'  and imposing the reduced pressure
  .
This limiting state is governed by two length scales,
namely
.
This limiting state is governed by two length scales,
namely  and
and  . The pressure
  drives the diameters to smaller values whereas
  drives
them to large ones (
drives
them to large ones ( is equal to the now-constant slope
of
is equal to the now-constant slope
of  as is shown in figure 4.5d). The
ratio of these two lengths, as expressed via
as is shown in figure 4.5d). The
ratio of these two lengths, as expressed via  , represents
the balance between the two forces.
, represents
the balance between the two forces.
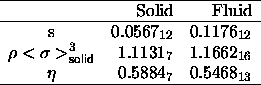
| Table: | Polydispersities, densities and volume
fractions of the solid fluid equilibrium at  . The subscript numbers indicate the error in the
last digit(s). . The subscript numbers indicate the error in the
last digit(s). |
The reduced coexistence pressure can be obtained from extrapolation of
 to
to  =0 as suggested by figure 4.1. The
equilibrium densities and volume fractions of the solid-fluid
coexistence in the limit
=0 as suggested by figure 4.1. The
equilibrium densities and volume fractions of the solid-fluid
coexistence in the limit  are displayed as open
circles in figure 4.4 and 4.3
respectively and are given in table 4.1. Because these
equilibrium points are at infinite pressure, these are really the end
points of the phase coexistence. For the choice of chemical potential
distribution given by eqn.
4.3, there is no phase
transition at higher polydispersities, volume fractions or densities.
are displayed as open
circles in figure 4.4 and 4.3
respectively and are given in table 4.1. Because these
equilibrium points are at infinite pressure, these are really the end
points of the phase coexistence. For the choice of chemical potential
distribution given by eqn.
4.3, there is no phase
transition at higher polydispersities, volume fractions or densities.
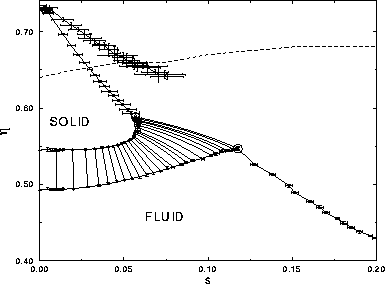
This method makes it possible to address the question of solid-fluid
phase continuity posed above: given that the coexistence region
terminates abruptly, why is it not possible to go from the solid to
the fluid via a continuous path in the  plane, that is,
without encountering a first order phase transition? The answer is
made clear by simulations at other, off-coexistence values of the
reduced pressure
plane, that is,
without encountering a first order phase transition? The answer is
made clear by simulations at other, off-coexistence values of the
reduced pressure  . The results are included in figure
4.6. The curve bounding the solid region from monodisperse
close packing (s=0,
. The results are included in figure
4.6. The curve bounding the solid region from monodisperse
close packing (s=0,  =1) to the solid-fluid coexistence
represents the infinite pressure line; a similar curve is shown for the
fluid phase (let us call these curves the ``
=1) to the solid-fluid coexistence
represents the infinite pressure line; a similar curve is shown for the
fluid phase (let us call these curves the `` -lines'').
The
-lines'').
The  -lines provide an upper limit, above which the
system cannot be compressed. This upper bound implies that it is not
possible to go from the solid to the fluid avoiding a first order
transition.
-lines provide an upper limit, above which the
system cannot be compressed. This upper bound implies that it is not
possible to go from the solid to the fluid avoiding a first order
transition.
Although all semigrand  states are of infinite pressure,
the
states are of infinite pressure,
the  -line does not correspond to close packed states one
would achieve in a canonical ensemble. The linear chemical potential
that arises in the infinite pressure limit is incapable of producing
the tight packing one normally associates with infinite pressure
(i.e. in a fixed-composition ensemble). In order to determine the
maximum volume fraction
-line does not correspond to close packed states one
would achieve in a canonical ensemble. The linear chemical potential
that arises in the infinite pressure limit is incapable of producing
the tight packing one normally associates with infinite pressure
(i.e. in a fixed-composition ensemble). In order to determine the
maximum volume fraction  of the solid phase as a function of
polydispersity, we performed simulations starting with a configuration
obtained by semigrand simulation at the
of the solid phase as a function of
polydispersity, we performed simulations starting with a configuration
obtained by semigrand simulation at the  -line and
compressing at fixed composition until every particle was constrained
by its neighbors. The maximum volume fraction
-line and
compressing at fixed composition until every particle was constrained
by its neighbors. The maximum volume fraction  so obtained was
averaged over ten different starting configurations with a different
diameter distribution snapshot. These averaged
so obtained was
averaged over ten different starting configurations with a different
diameter distribution snapshot. These averaged  as a function
of polydispersity are included in figure 4.6.
as a function
of polydispersity are included in figure 4.6.
It is immediately clear that there is a large difference between the
semigrand  -curve and the canonical results for
 . Simulations of larger systems indicate that this is not a
finite-size effect. The explanation is that the imposed linear
chemical potential difference function in the semigrand simulations is
simply not the one that produces the maximum volume fraction
. Simulations of larger systems indicate that this is not a
finite-size effect. The explanation is that the imposed linear
chemical potential difference function in the semigrand simulations is
simply not the one that produces the maximum volume fraction  .
To remove the difference between the canonical and semigrand picture
one could study other forms of
.
To remove the difference between the canonical and semigrand picture
one could study other forms of  .
.
| Figure: |
Phase diagram of polydisperse hard spheres in the  plane.
The coexistence region is as in figure 4.3. The curve joining the
terminal solid-phase coexistence point to the s=0 closed-packed
limit is the solid-phase plane.
The coexistence region is as in figure 4.3. The curve joining the
terminal solid-phase coexistence point to the s=0 closed-packed
limit is the solid-phase  -line (see text), while that
emanating from the liquid-phase terminus is the liquid-phase -line (see text), while that
emanating from the liquid-phase terminus is the liquid-phase
 -line. The solid line above the solid-phase -line. The solid line above the solid-phase
 -line describes the packing fractions obtained from the
fixed-composition compressions described in the text. Fluid-phase
random close packing obtained by Schaertl et al. [89] is
described by the dashed curve. -line describes the packing fractions obtained from the
fixed-composition compressions described in the text. Fluid-phase
random close packing obtained by Schaertl et al. [89] is
described by the dashed curve. |
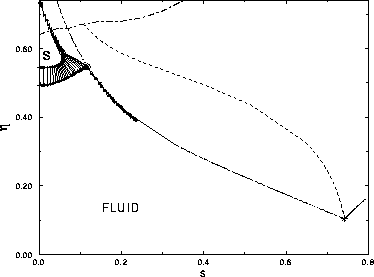
| Figure: |
Behavior of polydisperse hard spheres in the  plane. Phase diagram, plane. Phase diagram,  -lines, and random-close packing curves from figure 4.6 are included. Fluid-phase curves according to the Mansoori et al. [90] equation of state are presented for chemical potential distributions linear (dotted curve), quadratic (solid curve), and cubic (dashed curve) in the sphere diameter. The three lines converge at the infinitely polydisperse limit, for which a Monte Carlo datum [91] is indicated. -lines, and random-close packing curves from figure 4.6 are included. Fluid-phase curves according to the Mansoori et al. [90] equation of state are presented for chemical potential distributions linear (dotted curve), quadratic (solid curve), and cubic (dashed curve) in the sphere diameter. The three lines converge at the infinitely polydisperse limit, for which a Monte Carlo datum [91] is indicated. |
In the fluid phase there is also a fixed-composition maximum volume
fraction boundary: the random close packing volume fraction
 . Schaertl et al. [89] have studied
 as a function of polydispersity. Their results are
included in figure 4.6. The difference between the
semigrand
as a function of polydispersity. Their results are
included in figure 4.6. The difference between the
semigrand  -curve and the
  - curve is increasing
with polydispersity. As in the solid case, this difference can be
reduced by choosing other forms of the chemical potential
distribution function. We demonstrate via application of the
hard-sphere mixture equation of state of Mansoori et al. [90], which is
applicable to the fluid phase only. In figure 4.7, we plot the
packing fraction versus polydispersity according to this equation of
state, for the linear chemical potential distribution used in the
simulations, and for distributions that are quadratic or cubic in the
sphere diameter:
- curve is increasing
with polydispersity. As in the solid case, this difference can be
reduced by choosing other forms of the chemical potential
distribution function. We demonstrate via application of the
hard-sphere mixture equation of state of Mansoori et al. [90], which is
applicable to the fluid phase only. In figure 4.7, we plot the
packing fraction versus polydispersity according to this equation of
state, for the linear chemical potential distribution used in the
simulations, and for distributions that are quadratic or cubic in the
sphere diameter:

where we have examined cases in which only one of  , and
, and  is non-zero. The figure simply shows how other chemical potential
forms can give rise to larger densities than the ``infinite pressure''
results studied here. We note several points: (i) the case where
is non-zero. The figure simply shows how other chemical potential
forms can give rise to larger densities than the ``infinite pressure''
results studied here. We note several points: (i) the case where  =0 results in a so-called infinitely polydisperse mixture
[91], at which s=0.7414 and
=0 results in a so-called infinitely polydisperse mixture
[91], at which s=0.7414 and  =0.104; this situation
arises as
=0.104; this situation
arises as  ; (ii) the Mansoori
equation agrees very well with the Monte Carlo data we have taken at
and near the freezing transition, as well as at the infinitely polydisperse
limit; however, one would not expect the equation to apply at
conditions appropriate to random close packing, so we cannot describe
this limit in the present analysis; (iii) the
; (ii) the Mansoori
equation agrees very well with the Monte Carlo data we have taken at
and near the freezing transition, as well as at the infinitely polydisperse
limit; however, one would not expect the equation to apply at
conditions appropriate to random close packing, so we cannot describe
this limit in the present analysis; (iii) the  line is
terminated at a point (
line is
terminated at a point ( =0.507) where the computed
composition--which is an exponential of a cubic polynomial in
=0.507) where the computed
composition--which is an exponential of a cubic polynomial in
 --diverges because the coefficient of the cubic term becomes
positive (the
--diverges because the coefficient of the cubic term becomes
positive (the  and
and  lines are terminated on the figure at arbitrary
points).
lines are terminated on the figure at arbitrary
points).