chapter 4
 section 4.6
We performed a Gibbs-Duhem integration in the  plane starting
with an fcc solid and a fluid at the monodisperse hard sphere freezing
point. Both systems consisted of 256 particles and were well
equilibrated. Using the ghost-growing method of section 4.4 in
combination with eqn.
4.18 we found an initial slope of
plane starting
with an fcc solid and a fluid at the monodisperse hard sphere freezing
point. Both systems consisted of 256 particles and were well
equilibrated. Using the ghost-growing method of section 4.4 in
combination with eqn.
4.18 we found an initial slope of
 =1400 (
 50) (in units such that
  and
and  are unity).
This value was used in the first predictor
step to go from
are unity).
This value was used in the first predictor
step to go from  =0 to finite
  , where the slope could be
directly measured. We evaluated the coexistence line by gradually
increasing
, where the slope could be
directly measured. We evaluated the coexistence line by gradually
increasing  from one simulation to the next while integrating eqn.
4.10 to determine the pressure. In figure 4.1 the
equilibrium pressure is shown as a function of the polydispersity
parameter
from one simulation to the next while integrating eqn.
4.10 to determine the pressure. In figure 4.1 the
equilibrium pressure is shown as a function of the polydispersity
parameter  . The slope starts off at a value of
  =1400 as
we obtained from eqn.
4.18 and increases when
=1400 as
we obtained from eqn.
4.18 and increases when  is
increased. At a value of
is
increased. At a value of  =0.0056 the slope becomes infinite, so
we had to invert the integration, taking P as the independent
variable. In this case, we can calculate
=0.0056 the slope becomes infinite, so
we had to invert the integration, taking P as the independent
variable. In this case, we can calculate  for increasing
values of P by applying the same integration scheme to the
reciprocal of eqn.
4.10. Surprisingly, the equilibrium curve
continues to bend back, approaching
for increasing
values of P by applying the same integration scheme to the
reciprocal of eqn.
4.10. Surprisingly, the equilibrium curve
continues to bend back, approaching  =0 at infinite pressure. In
the inset of figure 4.1 we rescale the pressure to
=0 at infinite pressure. In
the inset of figure 4.1 we rescale the pressure to  , which remains finite and follows a straight
line as
, which remains finite and follows a straight
line as  . The fact that
 is finite in this limit actually allows us to perform
simulations at infinite pressure as will be discussed in the next
section.
is finite in this limit actually allows us to perform
simulations at infinite pressure as will be discussed in the next
section.
The divergence of the pressure is somewhat misleading. The pressure
indeed goes to infinity on a scale characterized by  , but
when reduced instead by the volume or an average diameter it remains
bounded. In fact, in this limit
, but
when reduced instead by the volume or an average diameter it remains
bounded. In fact, in this limit  loses its relevance as a
length scale because all particle diameters are going to values much
smaller than
loses its relevance as a
length scale because all particle diameters are going to values much
smaller than  . Scaling by an average diameter (or the
volume) makes the interpretation of the results more intuitive because
in experiments the important microscopic length scale is the
characteristic particle diameter. Consequently, in most of what
follows we present our results in terms of
. Scaling by an average diameter (or the
volume) makes the interpretation of the results more intuitive because
in experiments the important microscopic length scale is the
characteristic particle diameter. Consequently, in most of what
follows we present our results in terms of  (where the angle brackets indicate an isobaric semigrand ensemble
average). We choose arbitrarily to use
(where the angle brackets indicate an isobaric semigrand ensemble
average). We choose arbitrarily to use  of the
solid to perform the reduction; we could just as well have used the
fluid value. We will continue to refer to the limit of infinite
pressure because this represents a limiting behavior of our isobaric
semigrand system. It should be understood that in this case the
pressure is infinite on the
of the
solid to perform the reduction; we could just as well have used the
fluid value. We will continue to refer to the limit of infinite
pressure because this represents a limiting behavior of our isobaric
semigrand system. It should be understood that in this case the
pressure is infinite on the  scale but not on, say, the
 scale.
Although the parameter  shows a maximum as a function of P, the
real polydispersity---given in terms of the width of the composition
distribution
shows a maximum as a function of P, the
real polydispersity---given in terms of the width of the composition
distribution  ---does not. This polydispersity s is
defined as
---does not. This polydispersity s is
defined as

In figure 4.2 the reduced pressure
 is plotted against the polydispersity
s in both the fluid and the solid. The equilibrium pressure
increases monotonically until at infinite pressure a limiting value of
s and
is plotted against the polydispersity
s in both the fluid and the solid. The equilibrium pressure
increases monotonically until at infinite pressure a limiting value of
s and  is reached. From this plot it
becomes immediately clear that the polydispersity of the fluid and the
solid at equilibrium can be very different. As reviewed in the
introduction of this chapter,
this fact, although anticipated, was discounted in previous studies.
is reached. From this plot it
becomes immediately clear that the polydispersity of the fluid and the
solid at equilibrium can be very different. As reviewed in the
introduction of this chapter,
this fact, although anticipated, was discounted in previous studies.
| Figure: |
Phase diagram in the plane of volume fraction and polydispersity. Coexisting phases are joined by tie lines, which are
not straight because the polydispersity is not an additive
variable. The circles represent the endpoints of the coexistence
region at  , i.e., the terminal
polydispersity. , i.e., the terminal
polydispersity. |
| Figure: | Phase diagram in the plane of reduced number density and
polydispersity. Coexisting phases are joined by tie lines, which
although curved in reality are rendered straight in this figure. |
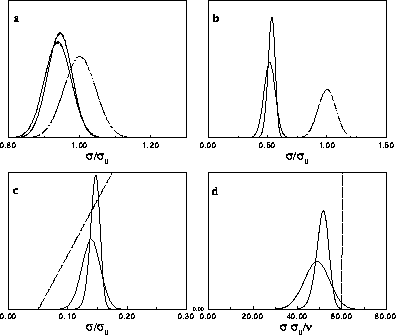
| Figure: |
Composition distributions  for fluid-solid equilibrium at different pressures. In the figures, the leftmost solid curve represents the fluid
composition, the rightmost one the solid phase composition.
a) for fluid-solid equilibrium at different pressures. In the figures, the leftmost solid curve represents the fluid
composition, the rightmost one the solid phase composition.
a)  for for  =15. The dotted curve is the imposed (Gaussian) activity distribution.
b) =15. The dotted curve is the imposed (Gaussian) activity distribution.
b)  for for  =100. The dotted curve is the imposed (Gaussian) activity distribution.
c) =100. The dotted curve is the imposed (Gaussian) activity distribution.
c)  for for  =6400. The dotted
line denotes the imposed chemical potential difference function, which is becoming straight at high =6400. The dotted
line denotes the imposed chemical potential difference function, which is becoming straight at high  .
d) .
d)  for for  .In this limit the diameters are pushed to zero. By dividing them by .In this limit the diameters are pushed to zero. By dividing them by  they remain finite. The dotted
line denotes the imposed chemical potential difference function. they remain finite. The dotted
line denotes the imposed chemical potential difference function. |
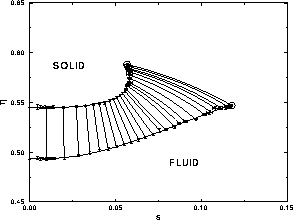
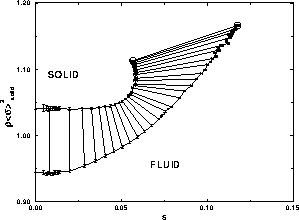
It is convenient to choose a density variable  given in terms of
the real volume fraction, because this is the quantity one measures in
experiments. We define
given in terms of
the real volume fraction, because this is the quantity one measures in
experiments. We define  ;
note that
;
note that  =0.7405 for monodisperse close packed spheres. The phase
diagram in the
=0.7405 for monodisperse close packed spheres. The phase
diagram in the  plane is shown in figure
4.3. Because the polydispersity variable is not
linearly additive, the tie-lines are curved. A system of hard spheres
prepared on one of the tie-lines will split into a solid and liquid
phase with density and polydispersity given by the intersection of the
tie-line with the coexistence lines. The most remarkable feature of
the diagram is the fact that the fluid-solid equilibrium suddenly
ends. This is generally consistent with the prediction and observation
of a terminal polydispersity reported in studies on crystallization of
polydisperse hard spheres [8,83,82] and reviewed in
section 4.1. In particular, the consensus of a terminal
polydispersity in the range of 5%--12% is explained by our
results. According to our phase diagram, the fcc solid phase is
thermodynamically stable for polydispersities no more than 5.7%, yet
crystallization is possible in fluids of polydispersity up to 12%
provided one allows for fractionation in the phase separation
process. This is consistent with Pusey's experiments [8]
in which he observed that dispersions with a polydispersity of 7.5%
would freeze, while those with a polydispersity of 12% did not. The
DFT studies which reported a terminal polydispersity of 5--7% are
also consistent with our results given their use of the constrained
eutectic, which precludes fractionation.
plane is shown in figure
4.3. Because the polydispersity variable is not
linearly additive, the tie-lines are curved. A system of hard spheres
prepared on one of the tie-lines will split into a solid and liquid
phase with density and polydispersity given by the intersection of the
tie-line with the coexistence lines. The most remarkable feature of
the diagram is the fact that the fluid-solid equilibrium suddenly
ends. This is generally consistent with the prediction and observation
of a terminal polydispersity reported in studies on crystallization of
polydisperse hard spheres [8,83,82] and reviewed in
section 4.1. In particular, the consensus of a terminal
polydispersity in the range of 5%--12% is explained by our
results. According to our phase diagram, the fcc solid phase is
thermodynamically stable for polydispersities no more than 5.7%, yet
crystallization is possible in fluids of polydispersity up to 12%
provided one allows for fractionation in the phase separation
process. This is consistent with Pusey's experiments [8]
in which he observed that dispersions with a polydispersity of 7.5%
would freeze, while those with a polydispersity of 12% did not. The
DFT studies which reported a terminal polydispersity of 5--7% are
also consistent with our results given their use of the constrained
eutectic, which precludes fractionation.
In figure 4.4, we plot the number density (in units of
the average diameter) as a function of s. This plot illustrates the
counterintuitive result that the fluid density may adopt values
greater than that in the solid phase. At the point where both
densities are equal the  term in eqn.
4.10
switches sign and becomes negative, which gives rise to the maximum of
term in eqn.
4.10
switches sign and becomes negative, which gives rise to the maximum of
 seen in figure 4.1. Of course, the fluid is able to
take on larger densities than the solid only because it is composed of
particles of smaller diameter.
seen in figure 4.1. Of course, the fluid is able to
take on larger densities than the solid only because it is composed of
particles of smaller diameter.
The composition distributions of the fluid and the solid phases are
displayed in figure 4.5 for four values of the coexistence
pressure. For a monodisperse equilibrium (not shown in the figures)
the distributions in both phases would be equal to the imposed
activity, which is a delta function at  . As the equilibrium
pressure (or equivalently the value of
. As the equilibrium
pressure (or equivalently the value of  ) is increased, the
composition distributions depart from the ideal activity. Although
still almost Gaussian, they are shifted considerably to lower values
of
) is increased, the
composition distributions depart from the ideal activity. Although
still almost Gaussian, they are shifted considerably to lower values
of  . The average diameter is smaller in the fluid, whereas the
solid composition is located at larger diameters and is more narrowly
distributed. The difference between the phases becomes more pronounced
at higher pressures. At infinite pressure, all diameters go to zero on
the scale of
. The average diameter is smaller in the fluid, whereas the
solid composition is located at larger diameters and is more narrowly
distributed. The difference between the phases becomes more pronounced
at higher pressures. At infinite pressure, all diameters go to zero on
the scale of  . Interesting distributions can be recovered by
proper scaling of the diameters by their average, as presented
in figure 4.5d. The fluid distribution is much broader than the solid
one, in accord with the larger polydispersity s we encountered
above. Although the value
. Interesting distributions can be recovered by
proper scaling of the diameters by their average, as presented
in figure 4.5d. The fluid distribution is much broader than the solid
one, in accord with the larger polydispersity s we encountered
above. Although the value  has decreased to zero in this limit
(and of course has the same value in the two phases), the (rescaled) composition
distributions are still near-Gaussian with a finite width (on a scale
of
has decreased to zero in this limit
(and of course has the same value in the two phases), the (rescaled) composition
distributions are still near-Gaussian with a finite width (on a scale
of  ). This curious outcome is a result of the
limiting process in which
). This curious outcome is a result of the
limiting process in which  while
while
 .
.
As the distributions are shifted to lower diameter at high pressure,
the precise shape of the imposed activity distribution becomes less
important and  , as discussed above, becomes irrelevant. In
figure 4.5c the chemical potential difference function, the
logarithm of the activity, is nearly a straight line; it becomes
exactly a straight line in the infinite pressure limit. This property
enables us to perform simulations in the limit of
, as discussed above, becomes irrelevant. In
figure 4.5c the chemical potential difference function, the
logarithm of the activity, is nearly a straight line; it becomes
exactly a straight line in the infinite pressure limit. This property
enables us to perform simulations in the limit of  .
.
chapter 4
section 4.6
Peter Bolhuis
Tue Sep 24 20:44:02 MDT 1996