


Next: The Onsager limit Up: Phase diagram in Previous: Results
Next: The Onsager limit
Up: Phase diagram in
Previous: Results
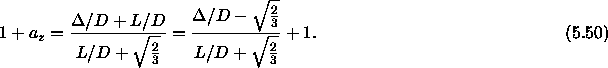
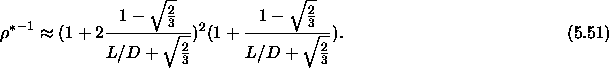
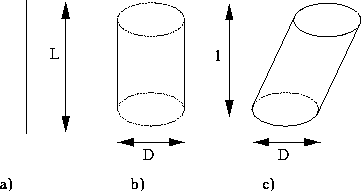
For lengths larger than approximately 7 a hexagonal crystal phase develops between the smectic and ABC-stacked solid phase. This crystal phase is characterized by hexagonally ordered layers which are stacked in an 'AAA' fashion. That is, a particle's hemisphere is right above the end-cap of a particle in the layer below it. In contrast, an fcc crystal is stacked in an 'ABC' manner, with the particles end-caps in one layer shifted with respect to the next layer (see figure 5.13). The 'AAA' crystal is more stable than the ABC crystal because the particles have a larger free volume. If they move along the z-direction they will on average only hit the particle right above or below. In the ABC stacking the number of interactions much larger, because the layer are shifted in position with respect to each other. At higher densities, the end-caps of particles in neighboring layers start to feel each other and the AAA stacked crystal will transform again to the ABC stacking. A rough but simple estimate for the AAA-ABC transition density can be made as follows. The reduced density of a crystal can be written in terms of the expansion from a close packed crystal

where  is the expansion of the lattice in the z-direction
starting
whereas
is the expansion of the lattice in the z-direction
starting
whereas  is the expansion in the xy-plane. Because the
particles are uniaxial, the expansion in the x and y plane are equal
(compare section 5.5.2).
The z-direction expansion has in general a different value. From
simulation results we can deduce that
is the expansion in the xy-plane. Because the
particles are uniaxial, the expansion in the x and y plane are equal
(compare section 5.5.2).
The z-direction expansion has in general a different value. From
simulation results we can deduce that  .
Further, the expansion
.
Further, the expansion  can be expressed as the ratio of the real
box length and the close packed crystal box length in the z-direction.
can be expressed as the ratio of the real
box length and the close packed crystal box length in the z-direction.
Here  is the interlayer spacing.
We assume that the AAA-ABC transition takes place when the distance
between layers
is the interlayer spacing.
We assume that the AAA-ABC transition takes place when the distance
between layers  is of the order of the diameter D. At that moment the end-caps
definitely start to feel each other and an ABC stacking is more
favorable.
This results in an estimate for the reduced transition density
is of the order of the diameter D. At that moment the end-caps
definitely start to feel each other and an ABC stacking is more
favorable.
This results in an estimate for the reduced transition density
This density is plotted in figure 5.2.
We could also estimate the AAA-ABC transition for  =10 and
 =20 from the equations of state in the crystal state. These
values are indicated as well in figure 5.2. The
agreement is reasonably good and suggests that the argument
of the hemispheres and the layer spacing is qualitatively correct.
=20 from the equations of state in the crystal state. These
values are indicated as well in figure 5.2. The
agreement is reasonably good and suggests that the argument
of the hemispheres and the layer spacing is qualitatively correct.
 . a) shows a
spherocylinder with finite L and zero D, the tilt angle goes as
. a) shows a
spherocylinder with finite L and zero D, the tilt angle goes as
 . b) is a blown up part of length 1 of spherocylinder a on the scale of
diameter D. The cylinder part still looks completely parallel to the
z-axis because the tilt angle is vanishing. c) Scaled particle. The
particle is scaled by a factor L along the z-axis. The hemispheres
have vanished, so the upper and lower plane of the cylinder is flat
and perpendicular to the z-axis. The particle is a shifted cylinder
because the total displacement of the unscaled sphero cylinder
. b) is a blown up part of length 1 of spherocylinder a on the scale of
diameter D. The cylinder part still looks completely parallel to the
z-axis because the tilt angle is vanishing. c) Scaled particle. The
particle is scaled by a factor L along the z-axis. The hemispheres
have vanished, so the upper and lower plane of the cylinder is flat
and perpendicular to the z-axis. The particle is a shifted cylinder
because the total displacement of the unscaled sphero cylinder 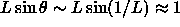 ,
although zero on the L scale, is not zero on the D scale .
,
although zero on the L scale, is not zero on the D scale .